Automation testing is not always a smooth ride. There are cases where the tests would not work as expected, in which cases debugging the test code (or implementation) is the only way out! Debugging issues in tests become even more difficult if the test suite comprises a large number of test methods.
Like me, many QA engineers would co-relate to this situation when performing Selenium automation testing. There could be cases where we need to understand the memory allocation of the objects which cannot be physically seen from the outside. Though the call stack might help in such scenarios, digging deeper into the internals of the test code and/or the automation framework would be super beneficial.
In all the above scenarios, the process of debugging the code comes into the picture. As an automation engineer, our end goal is to ensure that Selenium WebDriver scripts are executed in the best possible time! However, debugging in Selenium WebDriver is a useful method that should be leveraged effectively whenever there are not-to evident issues in the test code. We can debug Selenium WebDriver in Eclipse IDE when we are executing the test scripts.
Breaking the normal code flow by inserting breakpoints at strategic points can be used for debugging issues in the test code. In this blog, we deep dive into the essentials of debugging in Selenium WebDriver from a test automation point of view. We would also look at how to debug Selenium WebDriver in Eclipse and IntelliJ, the two popular IDEs for Selenium Java development.
What Is Debugging?
For starters, debugging is a scrutinized process that involves a deep understanding and minute examination of the source code. For example, the code might have failed, or there is a need to take a deep dive into the framework code to understand execution steps in a much better way. I would term this as a major perk of working with an open-source framework like Selenium. The process of debugging involves four main stages, namely identify, isolate, fix and review. In the first stage of debugging, we have to identify and understand the issue or failure in the code. This would help us to perform root cause analysis which is one of the key skills of a tester or developer. If one has identified the issue and understood its root cause, it would be easier to develop an approach to resolve the issue.
In the second stage, we have to isolate the portion of the code on which debugging has to be performed. However, it is not necessary to debug every line of code unless required. Therefore, we have to separate the faulty code into smaller chunks and perform debugging. Then by understanding the cause of the failure, a fix can be provided to the faulty code, which can be finally reviewed and merged. Of course, it has to be fixed and reviewed so that it doesn't break the other parts of the code.
Now let's see how to debug Selenium WebDriver in Eclipse with our testing framework, which consists of tests written using Selenium WebDriver and Java.
What are Breakpoints in Selenium WebDriver
Akin to software breakpoints, the breakpoints in Selenium WebDriver let us temporarily pause (or stop) the execution of the code. Once the execution is stopped, you can verify the essential elements of the source code.
When debugging in Selenium WebDriver, breakpoints should be inserted at appropriate places so that the required variable values (and other details) can be checked in detail. Whether you are using the Eclipse IDE or IntelliJ IDE, breakpoints are shown alongside the UI.
Did you know? CustomEvent interface represents any DOM event that can carry custom application-defined data.
How To Debug Selenium WebDriver In Eclipse
There are multiple ways to debug the code: having a code walkthrough, getting support from peers, refactoring and restructuring, etc. Debugging is often considered the easiest and most efficient way to debug the issue in the code. Several IDEs for web development provide the option of running the code and inserting breakpoints to debug the source code.
Since the steps involved in debugging mode look similar in most of the IDEs, you can use the IDE as per your requirements. Before running the tests in Eclipse IDE, set breakpoints at appropriate locations in the source code.
Breakpoint is usually a point where the code has to be stopped for further examination or understanding while debugging.
It is usually inserted in front of a single line or multiple lines in the code. By setting or inserting a breakpoint, the code will be executed up to the breakpoint, and the execution will halt once the breakpoint is encountered.
The breakpoint can be inserted into a single line or multiple lines of code, a method, and even a class.
Let us see how to insert a breakpoint in Eclipse IDE for debugging in Selenium WebDriver.
Inserting Breakpoints
To add a breakpoint in your code, you can follow either of the below ways.
Double click in the left side margin
Perform a right-click in the left side margin and click the Toggle Breakpoint option.
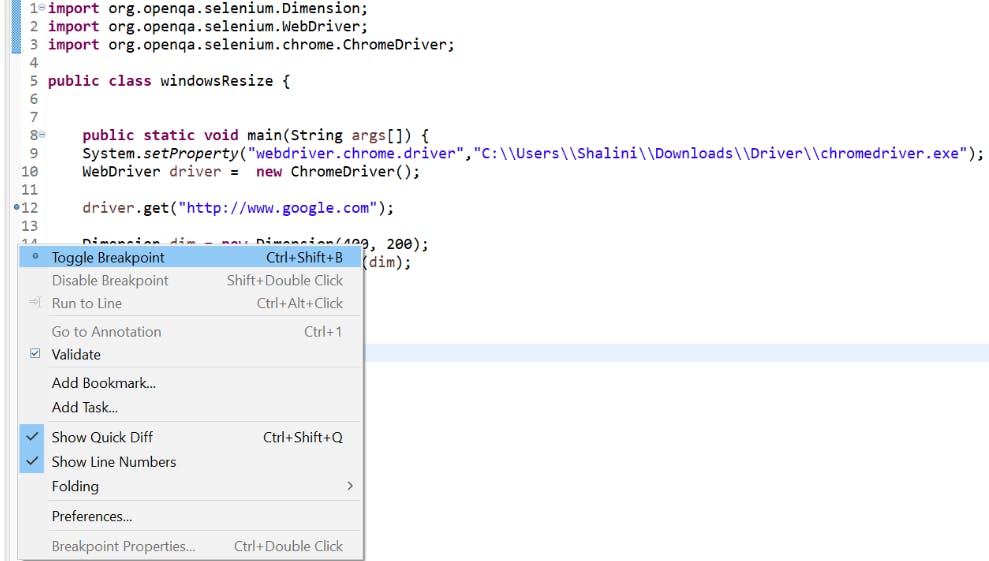
Move to the line where you need to add the breakpoint and then press CTRL+SHIFT+B.
Move to the line where you need to insert the breakpoint, click the Run menu, and click the Toggle Breakpoint option.
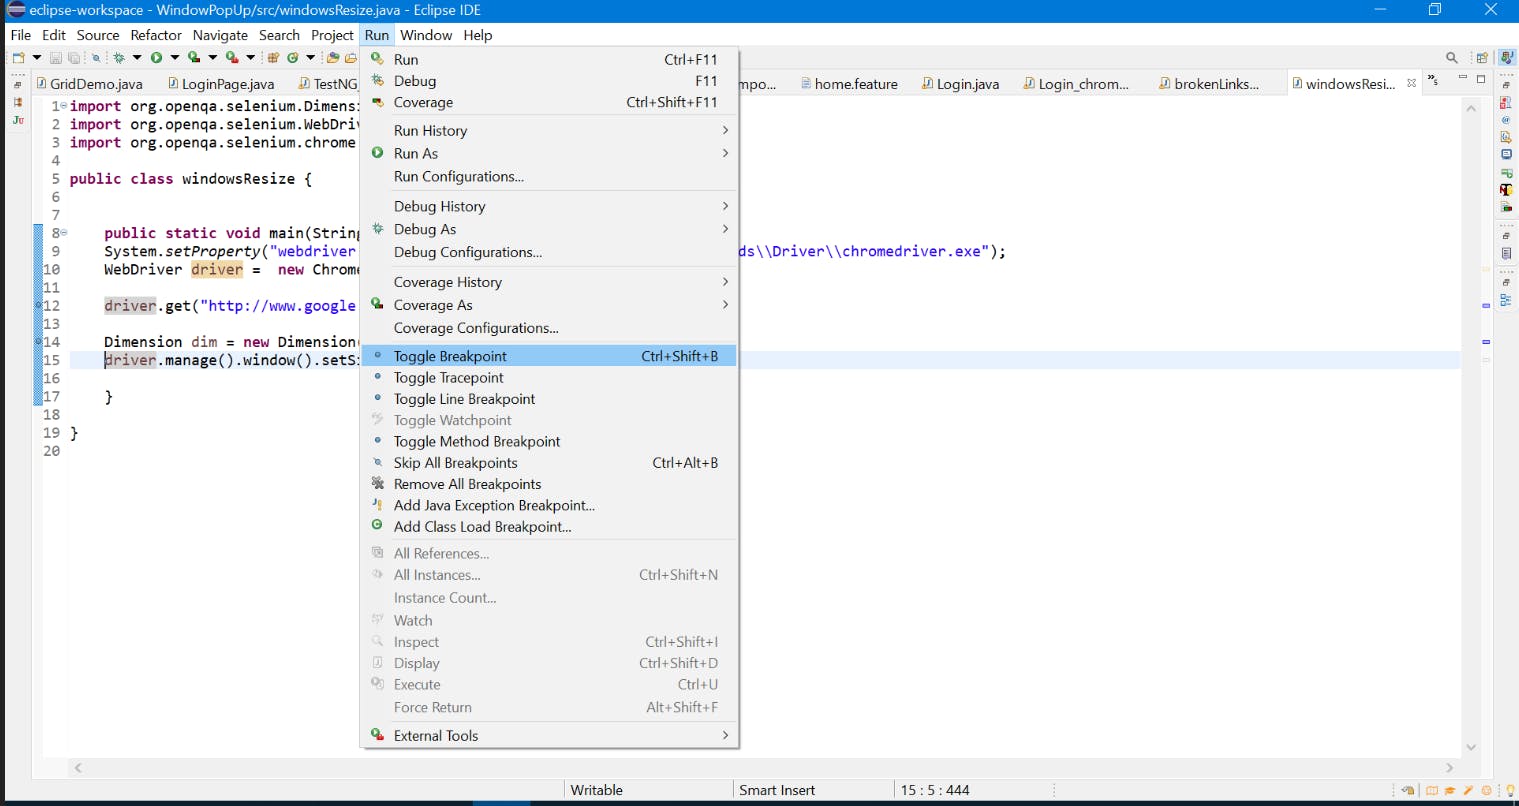
This way, you can add multiple breakpoints in your code. Once the breakpoint is added, you will see a blue circle on the left margin where you tried to insert the breakpoint.
Now that the breakpoint is added to the source code, it’s time to debug the issue.
Before running the code, we have to switch to Debug perspective. To do this, navigate to the Windows menu → Perspective → Open Perspective. Here, choose the Debug option.
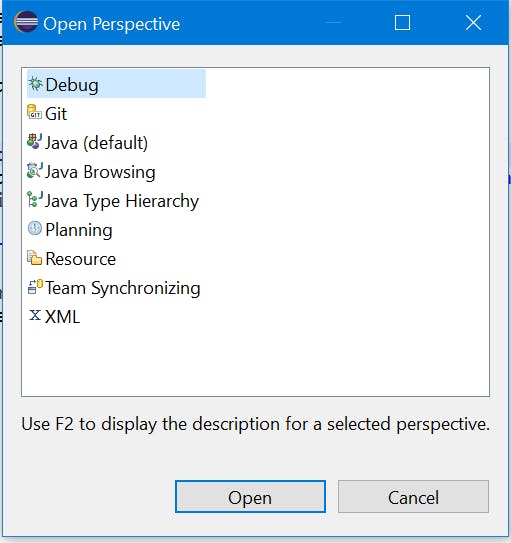
To run the code, you have to
- Select the Java class which has to be run in debug mode. Next, right-click on the class, move to Debug As an option, and click Java Application.
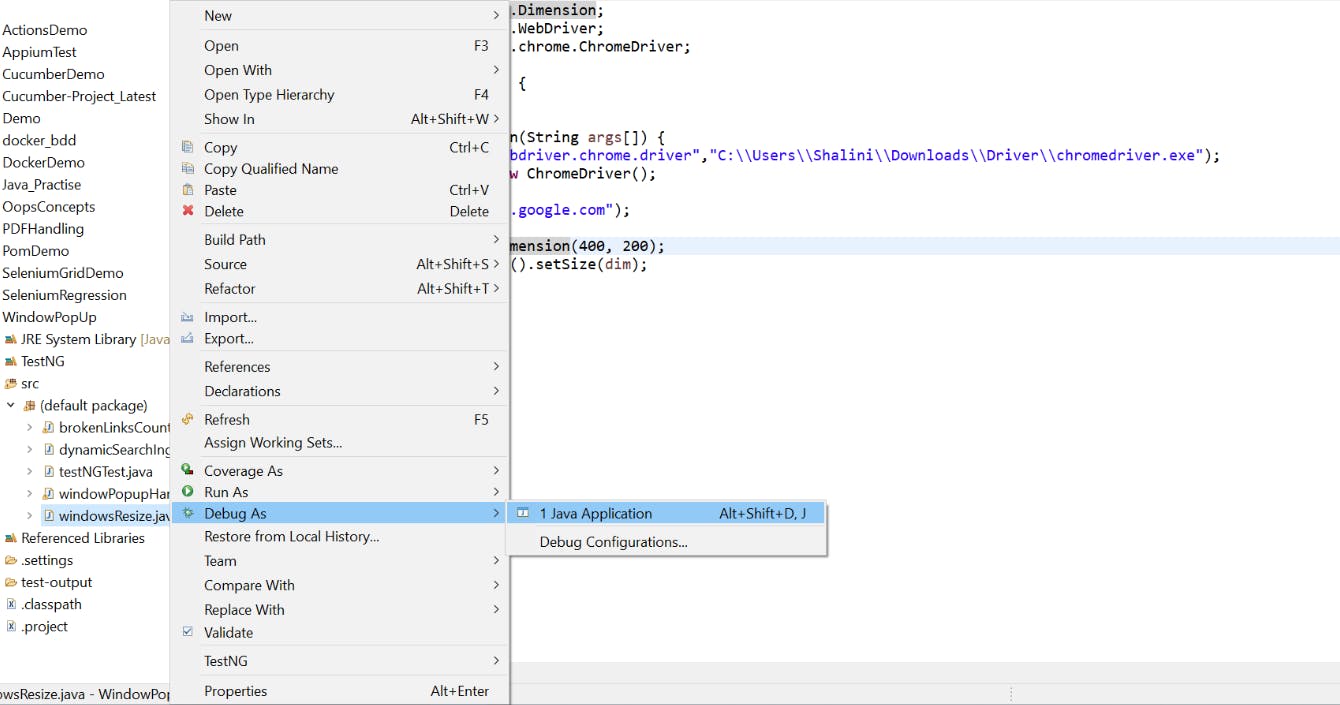
Within the class workspace, you can right-click, select Debug As → Java Application.
Click the Run menu. Navigate to Debug As option and then click Java Application.
You could also use the shortcut icon to run the code. Click the debug shortcut icon and then move to Debug As → Java Application.
You can also use Keyboard shortcut keys to run the code in debug mode. Press ALT+SHIFT+D. You will see a small popup on the screen like below
Press ‘J’ to select Debug Java Application and enter the debug mode.
If you haven’t switched to the debug perspective view before running the code, you will get a switch notification prompting you to switch to the Debug perspective before running the code. Click Switch.
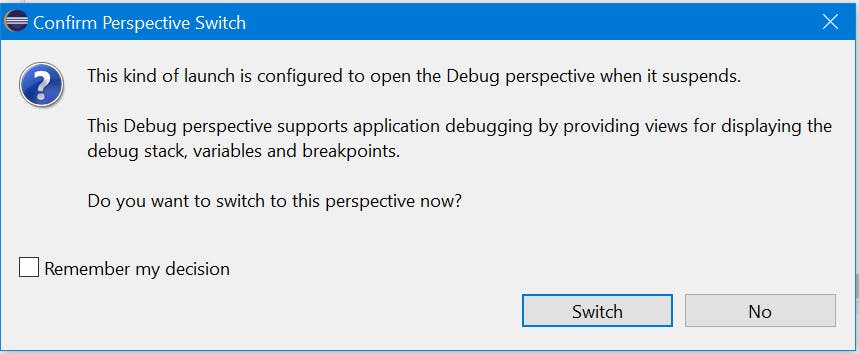
Now the code starts running in debug mode.
The code will be executed, and it stops when it reaches the line where the breakpoint has been added. For example, in my code, I have added breakpoints in lines 39,40,41,42, and 45. So, while running the code, the execution stops at line 39 as it is the first breakpoint in the code and then moves ahead one by one.
When the breakpoint has been reached, it will be highlighted, as shown in the below screenshot.
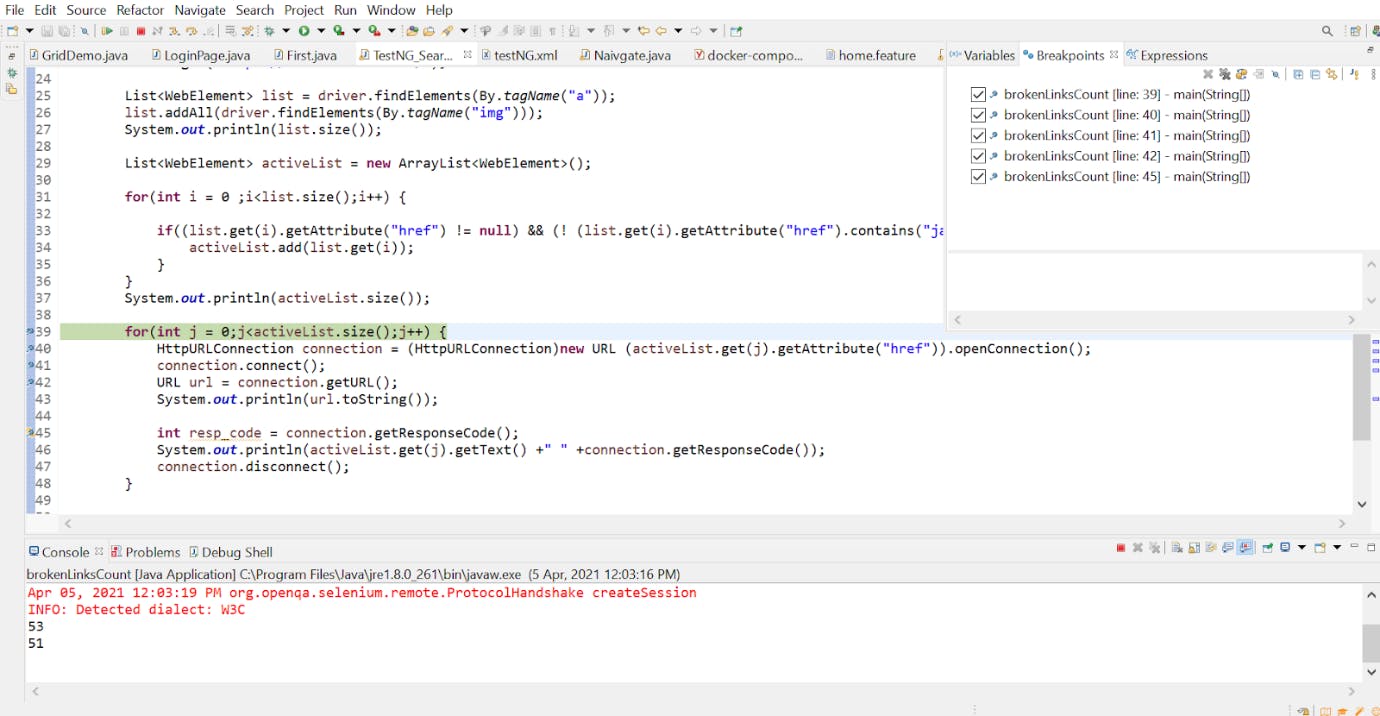
Once the execution starts, you could see a window that shows the variables, breakpoints, and expressions tab.
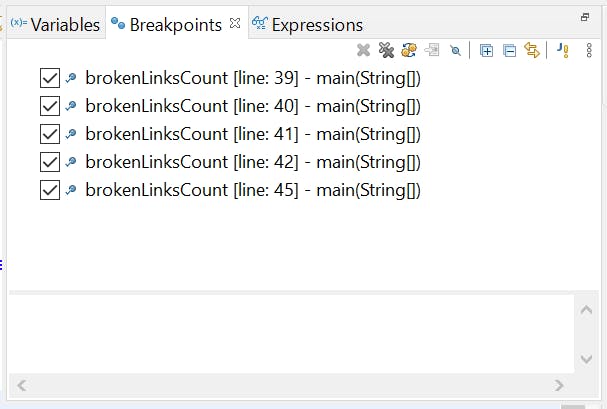
The Breakpoints tab shows the lines in which the breakpoint has been added. For example, this shows that the breakpoint has been added in lines 39,40,41,42, and 45 in the Java class brokenLinksCount.
The Variables tab shows the values being assigned to the variables in the line where the breakpoint has been added.
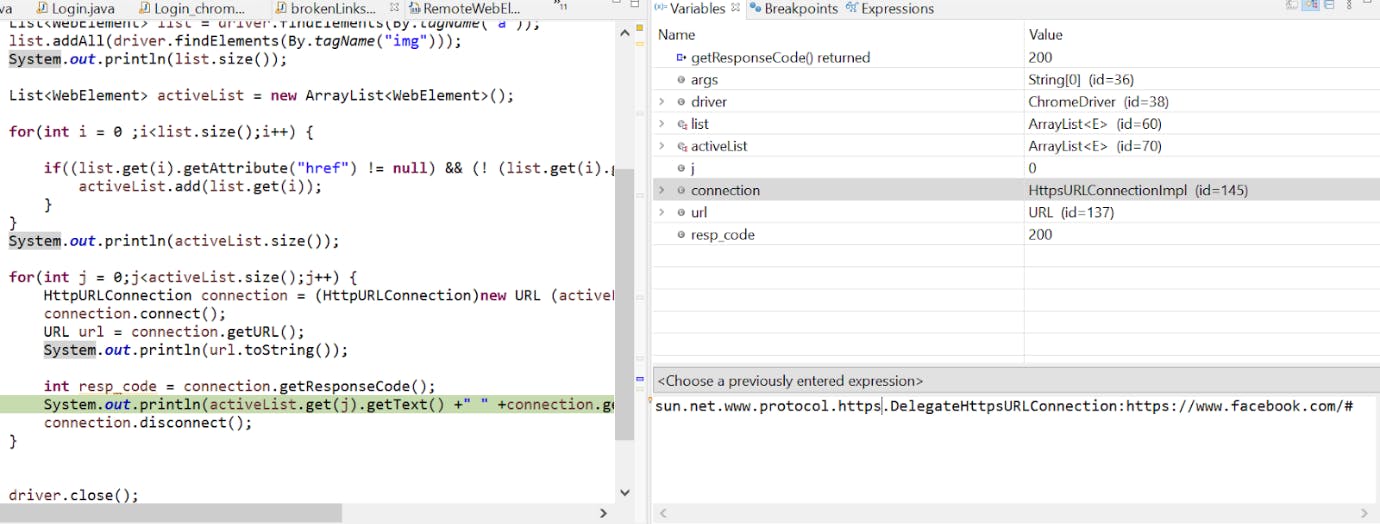
To control the execution, we have various shortcut keys in the editor. You could see them under the Run menu.
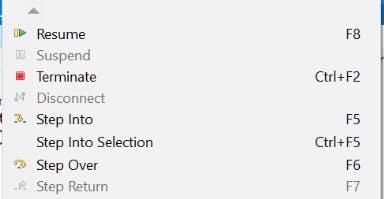
You can also view them in the submenu bar.

Let us understand their usage in more detail:
- Step Into (F5) The line where the breakpoint has been added will be executed, followed by the next lines. For example, if the breakpoint has been added to a method, then the control reaches inside the method and debugs the code written within that method.
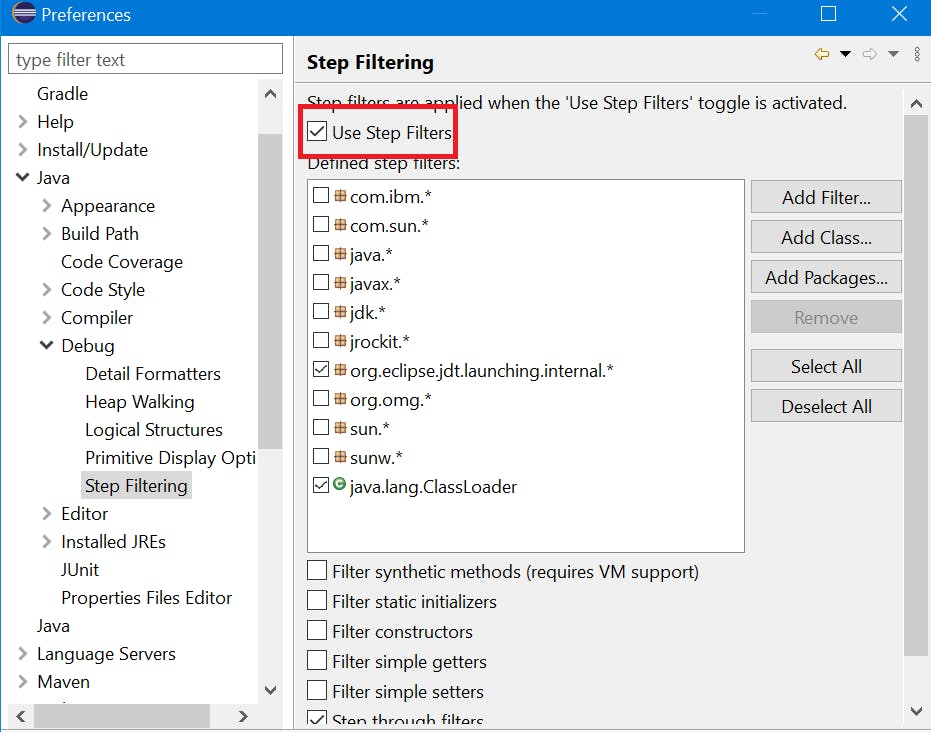
Sometimes the control might reach deep into the libraries and JDK classes which could be skipped by checking the Use Step Filters option.
Step Over (F6) When the control reaches the method where the breakpoint has been added, it steps to the next line after the method without getting into the method.
Step Return (F7) The control returns to the caller of the method once the breakpoint inserted in the method is executed.
Resume (F8) The code is executed until the control reaches the next breakpoint
Terminate (CTRL+F2) This is used to terminate the debugging or execution of the code forcibly.
Skip All Breakpoint (CTRL+ALT+B) This is used to skip all the breakpoints inserted in the code.
How to remove the inserted breakpoints?
Either of the following ways can remove the breakpoints added in the code.
A simple way to remove the added breakpoint is by double-clicking on the same point where it was added.
Right-click on the breakpoint and click Disable Breakpoint option.
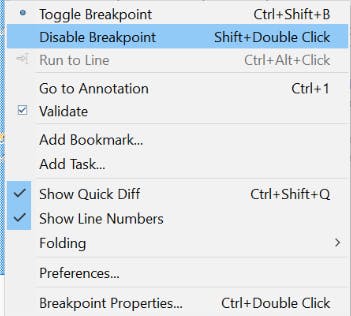
A breakpoint can also be removed by pressing SHIFT+double click on the breakpoint
The other option is by navigating to the Run menu → Remove All Breakpoints to remove all the breakpoints inserted in the code.
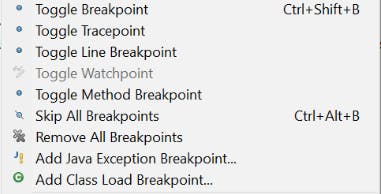
So far, we have seen the process of debugging in Selenium WebDriver by adding breakpoints in Eclipse. The idea of debugging seems to be almost the same across different IDEs.
Did you know? Do Not Track API enables websites to query the user's Do Not Track setting via Navigator.doNotTrack . The returned value is a promise that resolves to a boolean, "true" if Do Not Track is enabled, and false otherwise.
How To Debug Selenium WebDriver In IntelliJ
To add breakpoints in IntelliJ, you can choose either of the following ways, namely;
Double-click the left margin of the line in which the breakpoint has to be added.
Move to the line in which the breakpoint has to be added. Then, navigate to Run menu → Toggle Breakpoint → click Line Breakpoint.
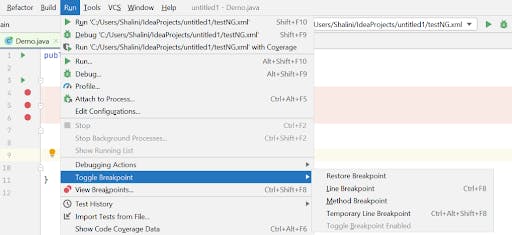
Once the breakpoint has been added, you can see a red circle on the left margin. Similarly, you can also add a method breakpoint to debug the methods in the framework.
Running The Code In Debug mode
Now we can begin to debug the code in our framework.
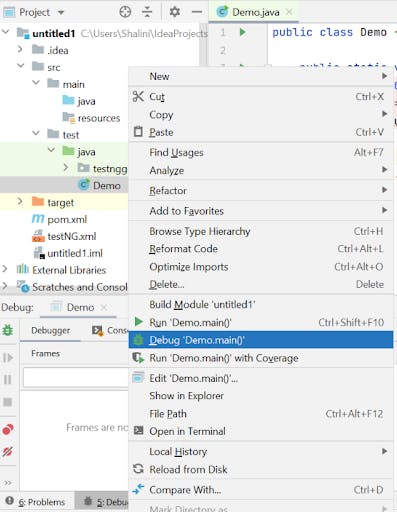
- Right-click on the class and click Debug.
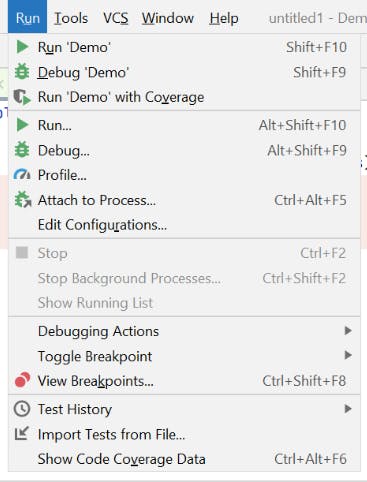
You can also run in the debug mode by clicking the Debug option under the Run menu.
You can also click the Debug icon on the top right side of the editor.

After clicking the debug option, you will see various options to control the execution under the Run menu.
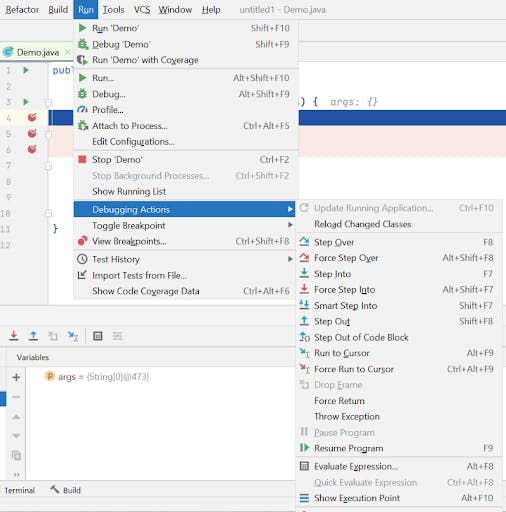
Once it reaches the breakpoints and executes the code, you can see tick marks on the breakpoints.
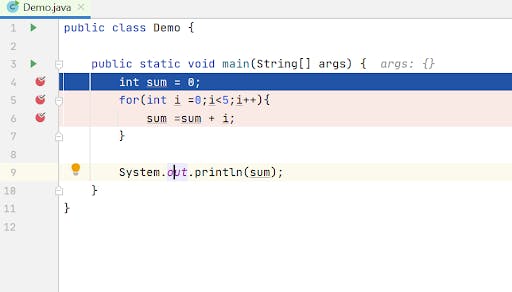
To terminate the debug mode, click the red square icon or the Stop option under the Run menu.
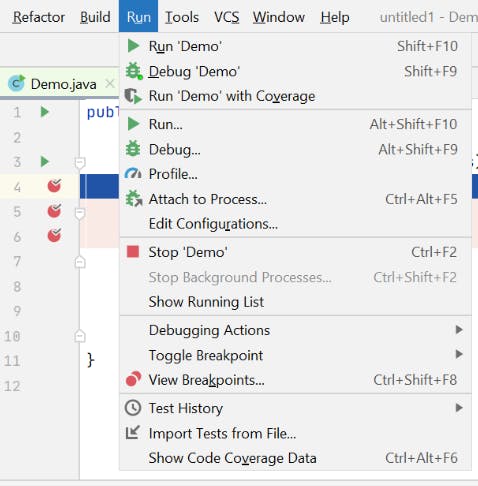
Now you would have got a clear picture of the similarity of the debugging process in different editors.
Let us understand an example for debugging in Selenium WebDriver.
Below is the code which was used for demonstrating debugging in Selenium WebDriver:
import java.net.HttpURLConnection;
import java.net.MalformedURLException;
import java.net.URL;
import java.util.ArrayList;
import java.util.List;

import org.openqa.selenium.By;
import org.openqa.selenium.WebDriver;
import org.openqa.selenium.WebElement;
import org.openqa.selenium.chrome.ChromeDriver;
import org.openqa.selenium.support.ui.ExpectedConditions;
import org.openqa.selenium.support.ui.WebDriverWait;

public class brokenLinksCount
{
   public static void main(String[] args) throws MalformedURLException, IOException
   {
       String username = "user-name";
       String access_key = "access-key";
       WebDriver driver = null;

       DesiredCapabilities capabilities = new DesiredCapabilities();
       capabilities.setCapability("build", "[Java] Finding broken links on a webpage using Selenium");
       capabilities.setCapability("name", "[Java] Finding broken links on a webpage using Selenium");
       capabilities.setCapability("platform", "Windows 10");
       capabilities.setCapability("browserName", "Chrome");
       capabilities.setCapability("version","latest");
       capabilities.setCapability("tunnel",false);
       capabilities.setCapability("network",true);
       capabilities.setCapability("console",true);
       capabilities.setCapability("visual",true);
       driver = new RemoteWebDriver(new URL("http://" + username + ":" + access_key + "@hub.lambdatest.com/wd/hub"),
               capabilities);
       System.out.println("Started session");

       driver.get("https://www.facebook.com/");

       List<WebElement> list = driver.findElements(By.tagName("a"));
       list.addAll(driver.findElements(By.tagName("img")));
       System.out.println(list.size());

       List<WebElement> activeList = new ArrayList<WebElement>();

       for(int i = 0 ;i<list.size();i++)
       {

           if((list.get(i).getAttribute("href") != null) && (! (list.get(i).getAttribute("href").contains("javascript"))) )
           {
                   activeList.add(list.get(i));
           }
       }
       System.out.println(activeList.size());

       for(int j = 0;j<activeList.size();j++)
       {
           HttpURLConnection connection = (HttpURLConnection)new URL (activeList.get(j).getAttribute("href")).openConnection();
           connection.connect();
           URL url = connection.getURL();
           System.out.println(url.toString());

           int response_code = connection.getResponseCode();
           System.out.println(activeList.get(j).getText());
           connection.disconnect();
       }
       driver.close();
   }
}
The above implementation is used to find broken links using Selenium WebDriver. As demonstrated earlier, we added breakpoints at appropriate places in the test code. Also, the tests are run on a cloud-based Selenium Grid provided by LambdaTest. Porting existing implementation from a local Selenium Grid to a cloud Grid requires minimal effort and also lets you reap benefits offered by parallel testing in Selenium.
Adding breakpoints at different points in the code will help us understand how each link in the website works and analyze the HTTP response code of each and every link, thereby understanding which link is broken. In addition, we can add breakpoints in for loops for debugging purposes if any link is broken and get to know the failure by getting the response code of the link.
Using breakpoints in the debugging mode helps analyze issues and fix the failure in the automation framework.
Did you know? with document.evaluate & XPath you can traverse various nodes in an XML/HTML document using XPath expressions. This allows you to look for specific attributes or content based upon a pattern.
Wrapping Up!
Debugging in Selenium WebDriver is the art of understanding the code flow in a framework, analyzing the issue, and fixing the faulty parts in the test code.
In this blog, we deep-dived into the importance of debugging in Selenium WebDriver for Selenium automation testing. We also looked at debugging in Selenium WebDriver using Eclipse and IntelliJ IDEs. I hope you have gained good knowledge in the process of debugging in Selenium WebDriver. Now it’s time to add breakpoints in your code and run them in debug mode to understand this process clearly.
Happy debugging!
